|
|
Post by VinCat❤Destined on Jul 6, 2015 18:50:14 GMT -5
Live+3 for Bob And Carol,Vincent And Cat 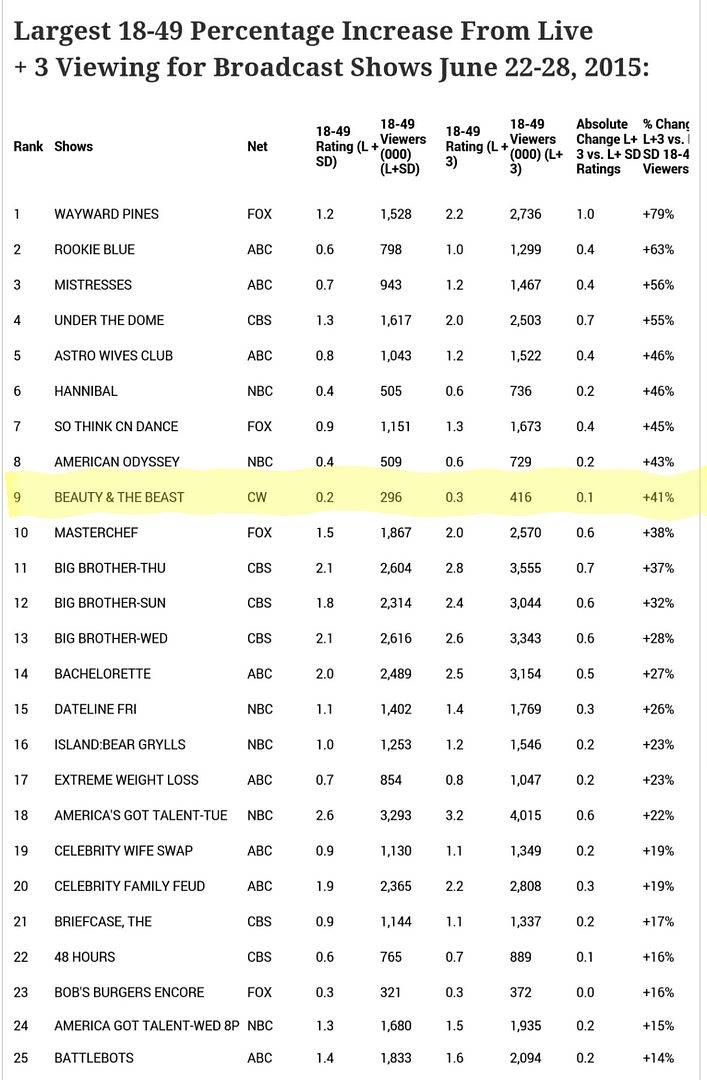 |
|
|
|
Post by anapi -season3baby :) on Jul 10, 2015 2:02:59 GMT -5
|
|
|
|
Post by jefferen on Jul 10, 2015 11:03:47 GMT -5
|
|
|
|
Post by alwayscrazedbatbfan on Jul 10, 2015 11:27:47 GMT -5
AMEN, Jefferen. The problem still comes back to the fact that we have an INCREDIBLE amount of loyal Beasties who you SEE spend money to keep the show on the air, yet NONE of us have those sacred Nielsen boxes (or anyway to get to someone that does). Digitally our presence is known, adn that has basically kept us on the air, along with the international fanbase.
here is the really sad thing when you think about it: for nielsen viewers, they actually look for people who would be home a lot of the day and night, meaning mostly non-professionals. And I think that if you actually polled our fanbase, you would find a great deal of highly educated people, with way too many work hours to match those degrees. So the Nielson family isn't looking for us. |
|
|
|
Post by Reyna on Jul 10, 2015 12:14:39 GMT -5
Ratings Breakdown
8:00 pm – 8:30 pm = 925,000 viewers / 0.3 demo
8:30 pm – 9:00 pm = 877,000 viewers / 0.2 demo
Preliminary Ratings
0.90 viewers / 0.25 demo
*Meaning the final demo will result in 0.2 or 0.3*
|
|
|
|
Post by BeastieBoy on Jul 10, 2015 12:17:47 GMT -5
Please please please can the rating gods do us a favor once and round up to a 0.3!
Wishful thinking I know. I'm resigned to another 0.2.
|
|
|
|
Post by VinCat❤Destined on Jul 10, 2015 15:41:51 GMT -5
Live+3 for Heart Of The Matter 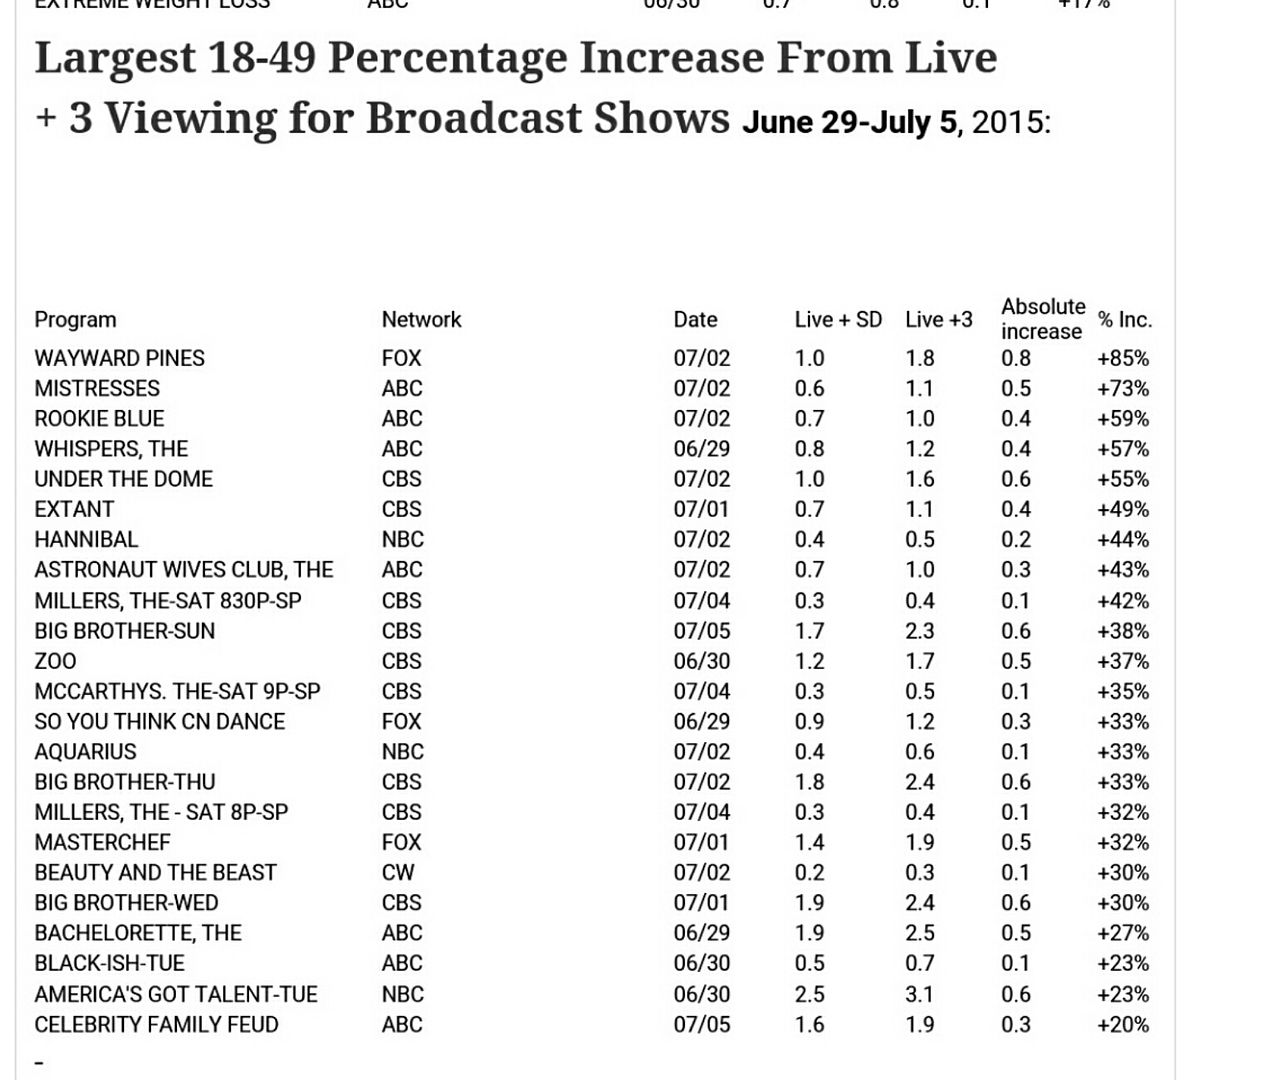 |
|
|
|
Post by anapi -season3baby :) on Jul 10, 2015 16:50:26 GMT -5
Please please please can the rating gods do us a favor once and round up to a 0.3! Wishful thinking I know. I'm resigned to another 0.2. exactly same as last week 0.2 and 0.86 |
|
|
|
Post by VinCat❤Destined on Jul 10, 2015 16:51:30 GMT -5
Please please please can the rating gods do us a favor once and round up to a 0.3! Wishful thinking I know. I'm resigned to another 0.2. exactly same as last week 0.2 and 0.86 I was about to post that LOL At this point it doesn't matter |
|
|
|
Post by anapi -season3baby :) on Jul 10, 2015 17:05:03 GMT -5
exactly same as last week 0.2 and 0.86 I was about to post that LOL At this point it doesn't matter yeah i know not bothered |
|
|
|
Post by alwayscrazedbatbfan on Jul 10, 2015 23:06:53 GMT -5
What. The. Freak. HOW can there be people who would rather watch a shallow reality show like Big Brother that emphasizes doing whatever it selfishly takes to get ahead and finding a way to screw others RATHER than a show about ROMANCE and BETTERING oneself by BUILDING UP one another and SAVING OTHERS??? Just WHAT am I missing?
A pox upon Nielsen boxes, I say, that give us statistics like this!
|
|
|
|
Post by BeastieBoy on Jul 10, 2015 23:26:45 GMT -5
I was about to post that LOL At this point it doesn't matter yeah i know not bothered While a 0.3 vs 0.2 probably doesn't matter, I'm still hoping for better. If we can get over a million viewers and back into in the 0.4-0.5 range in the latter part of S3, I think it will matter in how the CW treats the show. We might even be promoted back to a mid-season show vs. being relegated to a Summer also ran. And I'm still not giving up on S5! Oh well, each new episode brings new hope... |
|
|
|
Post by anapi -season3baby :) on Jul 11, 2015 1:04:05 GMT -5
While a 0.3 vs 0.2 probably doesn't matter, I'm still hoping for better. If we can get over a million viewers and back into in the 0.4-0.5 range in the latter part of S3, I think it will matter in how the CW treats the show. We might even be promoted back to a mid-season show vs. being relegated to a Summer also ran. And I'm still not giving up on S5! Oh well, each new episode brings new hope... but we would not jump from 0.2 to 0.4 or 0.5 yes we may get a few 0.3 episodes but no way more than that |
|
|
|
Post by pippin on Jul 11, 2015 1:12:38 GMT -5
No, the Live+ Same Day 18-49 demo only goes up or down based on how many "people"(actually Nielsen viewers) in that age group watch the show live or before 3am (apparently Nielsen considers 3am to be the same day). So Beauty's second episode was watched by 808,000 people over the age of 2. Of those 808,000 people, 329,000 of them were between the ages of 18-49. Those 329,000 18-49 year olds translate to a rounded 0.3 demo. The un-rounded demo was actually 0.259 so already the show was below a .3 demo in that age group. If 60,000 additional people watch the show the following week, but none of them are between the ages of 18-49, the demo would stay the same. Of course these numbers are all based on people in the Nielsen panel. A 0.3 demo means only 66 Nielsen panelists in the 18-49 demo are watching. A 0.259 18-49 demo means only around 55 Nielsen panelists are watching. It's not hard to imagine tha While Beauty may be adding some viewers, they are not in the key demo that the advertisers care about. Here are the unrounded 18-49 demo for Beauty's first four episode: 301 -- .287 = 0.3 302 -- .259 = 0.3 303 -- .233 = 0.2 304 -- .230 = 0.2 (this is still the preliminary number) So you can see that each week, the show has lost viewers (or really Nielsen panelists) in the 18-49 demo even as the overall viewership (or entire Nielsen viewing family) goes up or down. 301 -- 880,000 (all viewers) /353,000 (18-49 viewers) 302 -- 808,000 / 329,000 303 -- 863,000 / 296,000 (by my calculations) 304 -- 931,000 / 292,000 (estimate based on prelims) Of course the problem with these figures is they are based on the Nielsen family so even if all Nicole Gale Anderson's 664,000 Twitter follows, who are probably in the preferred 18-49 demo or more likely the coveted 18-34 demo, were to watch the next episode, if none were Nielsen panelists, the 18-49 demo and the viewership numbers would not reflect that. Very interesting. Thanks for the explanation, I get it now. So we're gaining viewers but they are either too young or more likely too old to affect the demo rating in a positive way. At the same time we're losing viewers in the preferred demo age group, hence the net is a lower demo rating. The other issue here is accuracy. I wonder if the population sample is statistically really large enough since BATB is on the low end of the ratings spectrum? I would assume the Nielsen mathematicians must have figured out the statistics. However, it seems like such a slim number can tip the scales one way or the other (e.g. + or - 5 Nielsen panel viewers in the preferred age group). This is true.With so few people watching, a few panelists can change the demo from a .3 to a .2 since the numbers are rounded 0.250 gets your demo rounded up to a 0.3 and a 0.249 rounds down to a 0.2. But the networks see the unrounded numbers so they know where a show is really at or which way it is heading. Last season, despite the online unhappiness expressed about the "love triangles," the show didn't really lose any Nielsen viewers in the key demo. The demo basically fluctuated between 0.27 and 0.31 with a random high of 0.37 for the 12th episode and a random low of 0.23 for the 16th. This season so far the key demo is showing a steady downward trend for the first 5 episodes: 0.278 0.259 0.233 0.224 0.213. Obviously the network didn't care about the US Nielsen numbers when they renewed the show. Hopefully they didn't make that decision thinking the show would maintain its high 0.2 low 0.3 demo Very interesting. Thanks for the explanation, I get it now. So we're gaining viewers but they are either too young or more likely too old to affect the demo rating in a positive way. At the same time we're losing viewers in the preferred demo age group, hence the net is a lower demo rating. The other issue here is accuracy. I wonder if the population sample is statistically really large enough since BATB is on the low end of the ratings spectrum? I would assume the Nielsen mathematicians must have figured out the statistics. However, it seems like such a slim number can tip the scales one way or the other (e.g. + or - 5 Nielsen panel viewers in the preferred age group). the other issue may be that the target demo is anyway naturally lower during the summer months as younger people are more likely to be out and about in summer - also considering that the show airs early this week we got 0.2 in the 18-34 target group and 0.3 in the 25-54 (not final numbers yet, these delayed cause of 4th of july) anyway i am not fussed. the numbers of people watching are steady or slightly higher so in my eyes (i know i am not an advertiser) we are not doing worse, also considering summer, no lead in, shows tend to do worse in summer etc i dont even think at this stage a difference like this will help determine whether we air sooner or later (0.2 vs 0.3)...i still think that unless something goes majorly wrong with their fall/mid season line up we will air in may/june oh and yes i do think even though broadly correct the sample is indeed very small so it would not be fully accurate considering as u say the batb low overall viewership. we were always in the low 0.3s or high 0.2s (which rounded to 0.3) so just very few nielsen viewers in the target demo not watching would bring us down to 0.2 - that does not necessarily reflect the reality. so in reality we may be 0.3 .... lol it is incredible how we are looking at the 0.1 points as something so important given that for some shows the 0.1 difference is nothing  I think if Beauty could have stayed in the .3 and managed a .4 here or there, it might have had a shot of replacing Reign mid season if Reign continued to drop. Beauty's 0.3 didn't look so bad, especially when NBC's Hannibal and American Odyssey were putting up 0.4 and 0.5, but now we are down to a 0.2 and Penn and Teller just returned this Monday to the CW with a 0.498 and 1.66 million viewers followed by WLIIA with a .424 and 1.27 million viewers. Ratings Breakdown8:00 pm – 8:30 pm = 925,000 viewers / 0.3 demo
8:30 pm – 9:00 pm = 877,000 viewers / 0.2 demoPreliminary Ratings0.90 viewers / 0.25 demo
*Meaning the final demo will result in 0.2 or 0.3* TVMediaInsights gives the rounded half hour demos, so using their numbers doesn't give you the actual demo. The unrounded Preliminary demo was really a 0.221, so unfortunately, when you do the math, the half hours demos were probably something like 0.255 (rounds to a 0.3) and 0.187 (rounds to a 0.2) The final unrounded demo came in at 0.213 |
|
|
|
Post by anapi -season3baby :) on Jul 11, 2015 1:38:31 GMT -5
Very interesting. Thanks for the explanation, I get it now. So we're gaining viewers but they are either too young or more likely too old to affect the demo rating in a positive way. At the same time we're losing viewers in the preferred demo age group, hence the net is a lower demo rating. The other issue here is accuracy. I wonder if the population sample is statistically really large enough since BATB is on the low end of the ratings spectrum? I would assume the Nielsen mathematicians must have figured out the statistics. However, it seems like such a slim number can tip the scales one way or the other (e.g. + or - 5 Nielsen panel viewers in the preferred age group). This is true.With so few people watching, a few panelists can change the demo from a .3 to a .2 since the numbers are rounded 0.250 gets your demo rounded up to a 0.3 and a 0.249 rounds down to a 0.2. But the networks see the unrounded numbers so they know where a show is really at or which way it is heading. Last season, despite the online unhappiness expressed about the "love triangles," the show didn't really lose any Nielsen viewers in the key demo. The demo basically fluctuated between 0.27 and 0.31 with a random high of 0.37 for the 12th episode and a random low of 0.23 for the 16th. This season so far the key demo is showing a steady downward trend for the first 5 episodes: 0.278 0.259 0.233 0.224 0.213. Obviously the network didn't care about the US Nielsen numbers when they renewed the show. Hopefully they didn't make that decision thinking the show would maintain its high 0.2 low 0.3 demo the other issue may be that the target demo is anyway naturally lower during the summer months as younger people are more likely to be out and about in summer - also considering that the show airs early this week we got 0.2 in the 18-34 target group and 0.3 in the 25-54 (not final numbers yet, these delayed cause of 4th of july) anyway i am not fussed. the numbers of people watching are steady or slightly higher so in my eyes (i know i am not an advertiser) we are not doing worse, also considering summer, no lead in, shows tend to do worse in summer etc i dont even think at this stage a difference like this will help determine whether we air sooner or later (0.2 vs 0.3)...i still think that unless something goes majorly wrong with their fall/mid season line up we will air in may/june oh and yes i do think even though broadly correct the sample is indeed very small so it would not be fully accurate considering as u say the batb low overall viewership. we were always in the low 0.3s or high 0.2s (which rounded to 0.3) so just very few nielsen viewers in the target demo not watching would bring us down to 0.2 - that does not necessarily reflect the reality. so in reality we may be 0.3 .... lol it is incredible how we are looking at the 0.1 points as something so important given that for some shows the 0.1 difference is nothing I think if Beauty could have stayed in the .3 and managed a .4 here or there, it might have had a shot of replacing Reign mid season if Reign continued to drop. Beauty's 0.3 didn't look so bad, especially when NBC's Hannibal and American Odyssey were putting up 0.4 and 0.5, but now we are down to a 0.2 and Penn and Teller just returned this Monday to the CW with a 0.498 and 1.66 million viewers followed by WLIIA with a .424 and 1.27 million viewers. Ratings Breakdown8:00 pm – 8:30 pm = 925,000 viewers / 0.3 demo
8:30 pm – 9:00 pm = 877,000 viewers / 0.2 demoPreliminary Ratings0.90 viewers / 0.25 demo
*Meaning the final demo will result in 0.2 or 0.3* TVMediaInsights gives the rounded half hour demos, so using their numbers doesn't give you the actual demo. The unrounded Preliminary demo was really a 0.221, so unfortunately, when you do the math, the half hours demos were probably something like 0.255 (rounds to a 0.3) and 0.187 (rounds to a 0.2) The final unrounded demo came in at 0.213 wow 0.213 is really really low considering our viewership has not fallen from last year... do u know if generally in summer the young demo tends to fall?is there such a pattern? |
|